Retail Business Intelligence Strategies for Multi-Store Growth

Cheta Pandya
When a major retail chain centralized its disconnected data sources under a single analytics layer, the results weren't about better reports.
Regional managers who previously pulled from four separate systems POS, loyalty, inventory, and eCommerce and reconciled outputs in spreadsheets that disagreed by week's end were suddenly making replenishment decisions before the weekend. Not three weeks after. That shift didn't come from better data. It came from data that arrived in time to act on.
Most multi-store chains are still waiting. According to Forrester, 77% of retailers struggle to convert collected data into actionable insight, and 67% aren't capturing it in a form that supports decisions at all. According to Gartner, more than half of business decisions still run on gut instinct because data arrives after the moment has passed.
For a chain operating 12, 40, or 200 stores, that lag compounds into margin erosion nobody can trace to a single bad call. A dashboard nobody trusts isn't a business intelligence strategy. It's a documentation of a dysfunction.
Retail business intelligence fixes the structure, not just the reporting. This blog breaks down the strategies that actually move multi-store revenue: where the data lives, what to measure, how pricing and competitive intelligence fit in, and what a computer vision retail intelligence platform adds that dashboards alone cannot.
What is Retail Business Intelligence?
Retail business intelligence is the integration of disparate store data (POS, inventory, footfall, and loyalty) into a unified analytics layer. It allows regional managers to shift from end-of-week historical reporting to real-time, predictive decision-making across pricing and supply chain operations.
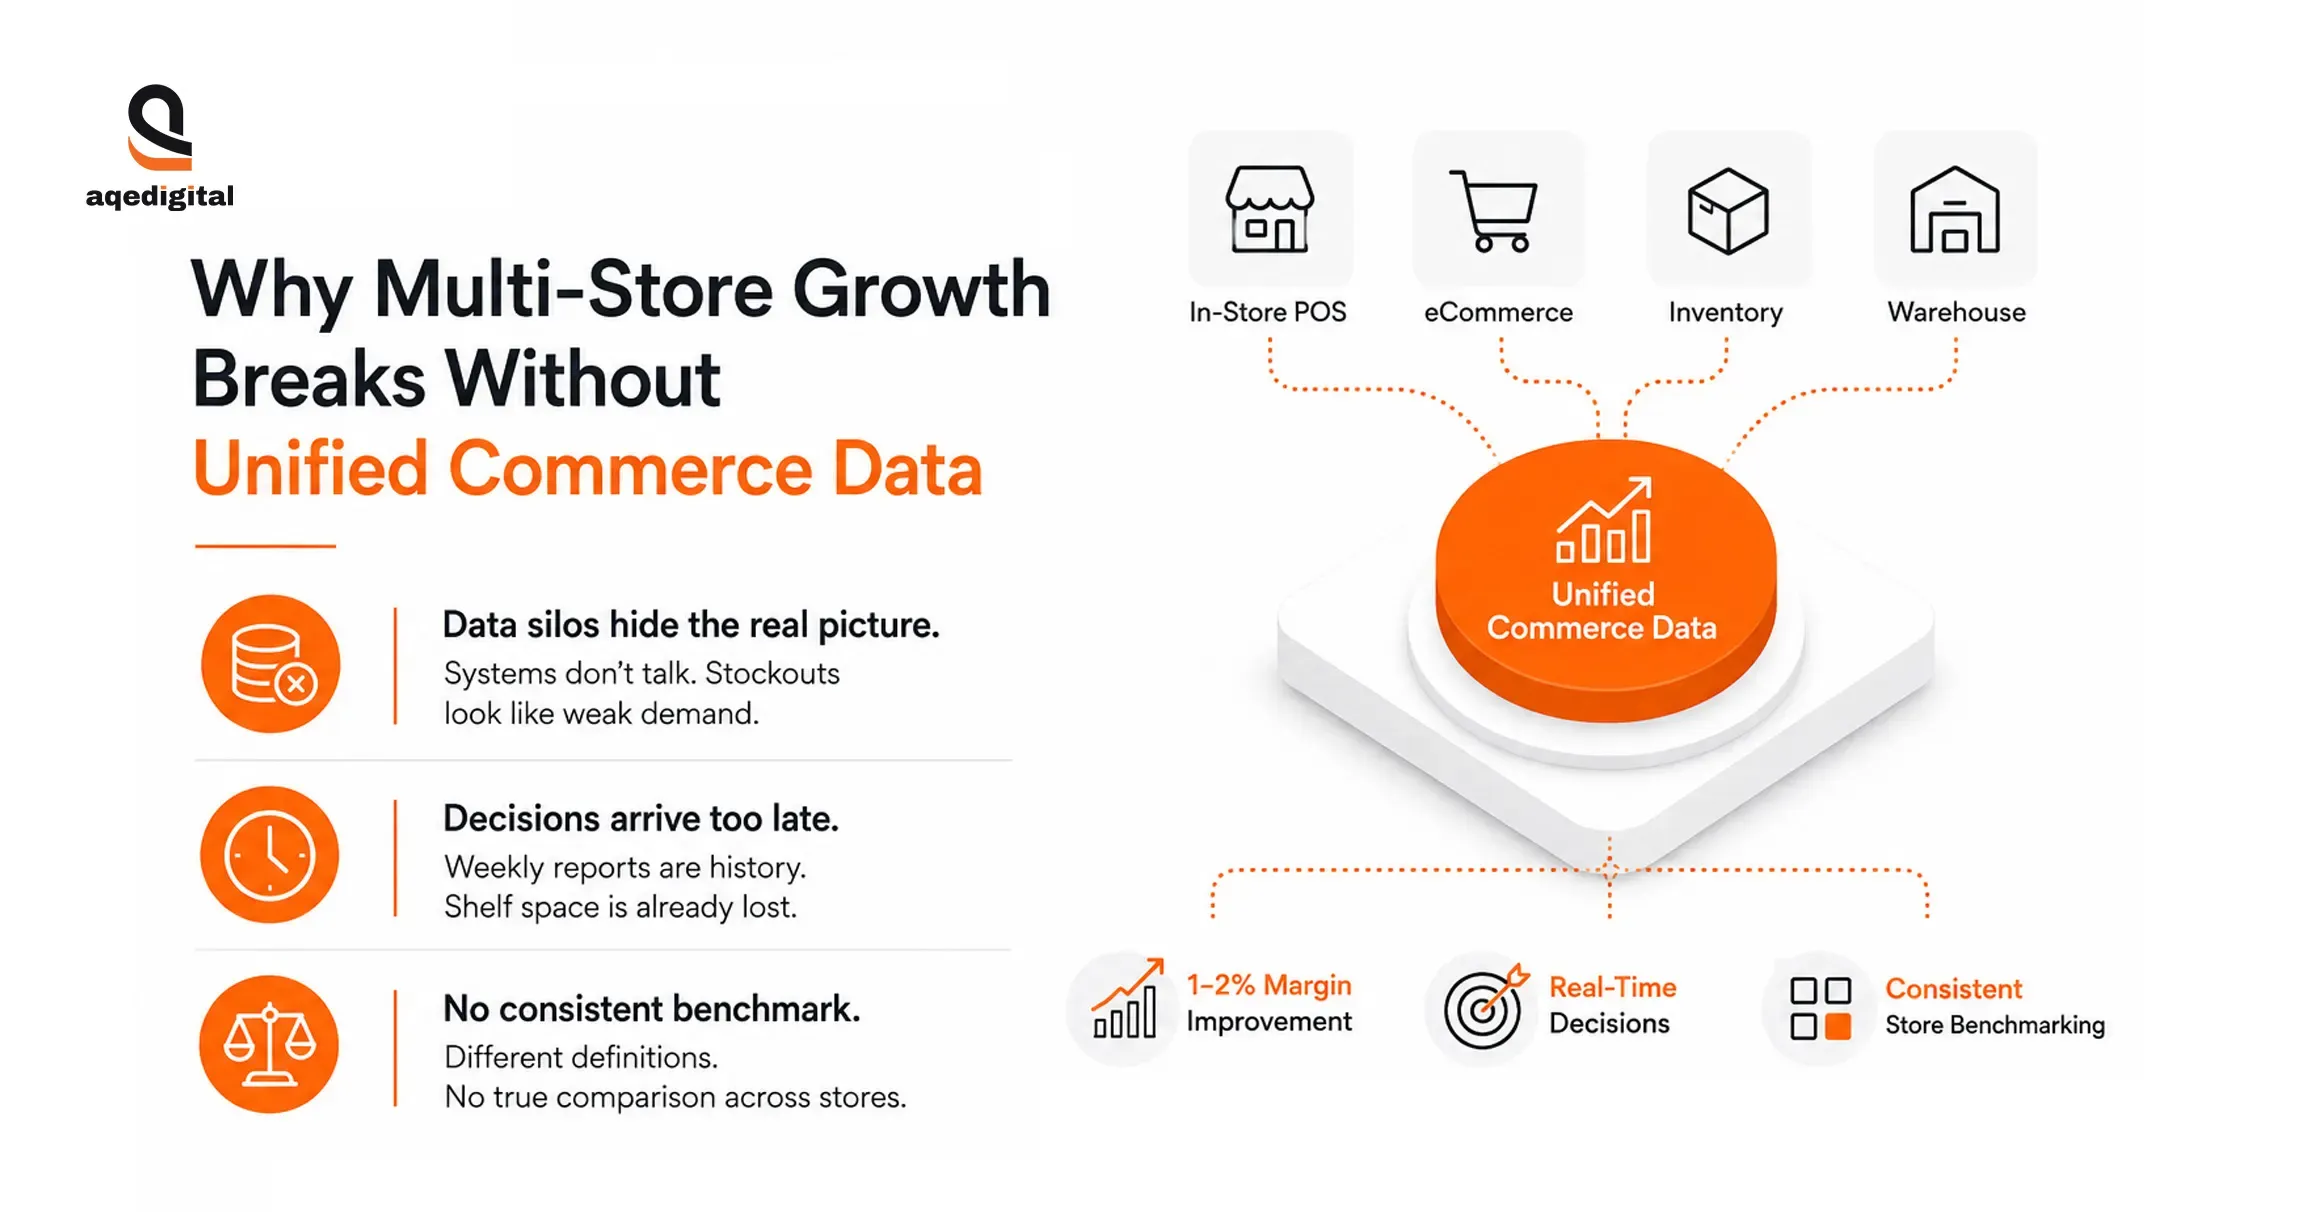
Why Multi-Store Growth Breaks Without Unified Commerce Data?
What works in one location breaks across forty others. Consider how global leaders like Target completely overhauled their supply chain operations. They realized that static, chain-wide inventory models led to massive markdowns in some regions and stockouts in others. By shifting to store-level predictive analytics, they reclaimed millions in margin.
For mid-market retailers, capturing a 1%-2% margin improvement is significant. It is often the exact difference between aggressive expansion and total stagnation.
The problem is rarely a lack of ambition. It is a lack of visibility. When each store reports differently, the head office cannot compare like for like.
| Legacy Store Reporting vs. Advanced Retail Business Intelligence | |||
| Capability | Legacy Store Reporting | Advanced Retail BI | Business Impact |
| Data Cadence | End-of-week batch reports | Real-time / Intra-day | Eliminate multi-day stockouts |
| Pricing | Static, chain-wide price books | Dynamic, SKU-store level | Capture 1–2% margin improvement |
| Visibility | Transactional (What sold) | Computer Vision (What was ignored) | Optimize planograms instantly |
1. Data silos hide the real picture.
Your NCR or Square POS knows what sold. Your Shopify Plus backend knows what moved online. Your inventory system knows what sits in the warehouse. Rarely do these platforms talk to each other in real time. So, a stockout in Store 14 looks like weak demand when it is actually a supply gap. A multi-store data strategy stitches these sources into a single version of the truth.
2. Decisions arrive too late to matter.
Weekly reports describe a week that is already gone. According to a 2024 Gartner report on retail analytics, more than half of business decisions are still made on gut feel because the data arrives too late to act on.
By the time a slow-moving SKU shows up in a Monday deck, three days of shelf space are wasted. Modern analytics shifts the cadence from rearview reporting to same-day signals, allowing category managers to reallocate stock while the week is still live.
3. No consistent benchmark across stores
Without a shared metric layer, every store manager defends their own numbers. One counts footfall at the door, another at the till. Unified retail analytics enforces one definition, one source, and one comparison.
If your store data lives in five systems that never agree, your growth ceiling is permanently set by your slowest report.
The Enterprise Retail BI Architecture
You cannot build predictive retail models on fragile data pipelines. A true multi-store retail BI strategy requires a modern data stack designed for high-velocity transaction data.
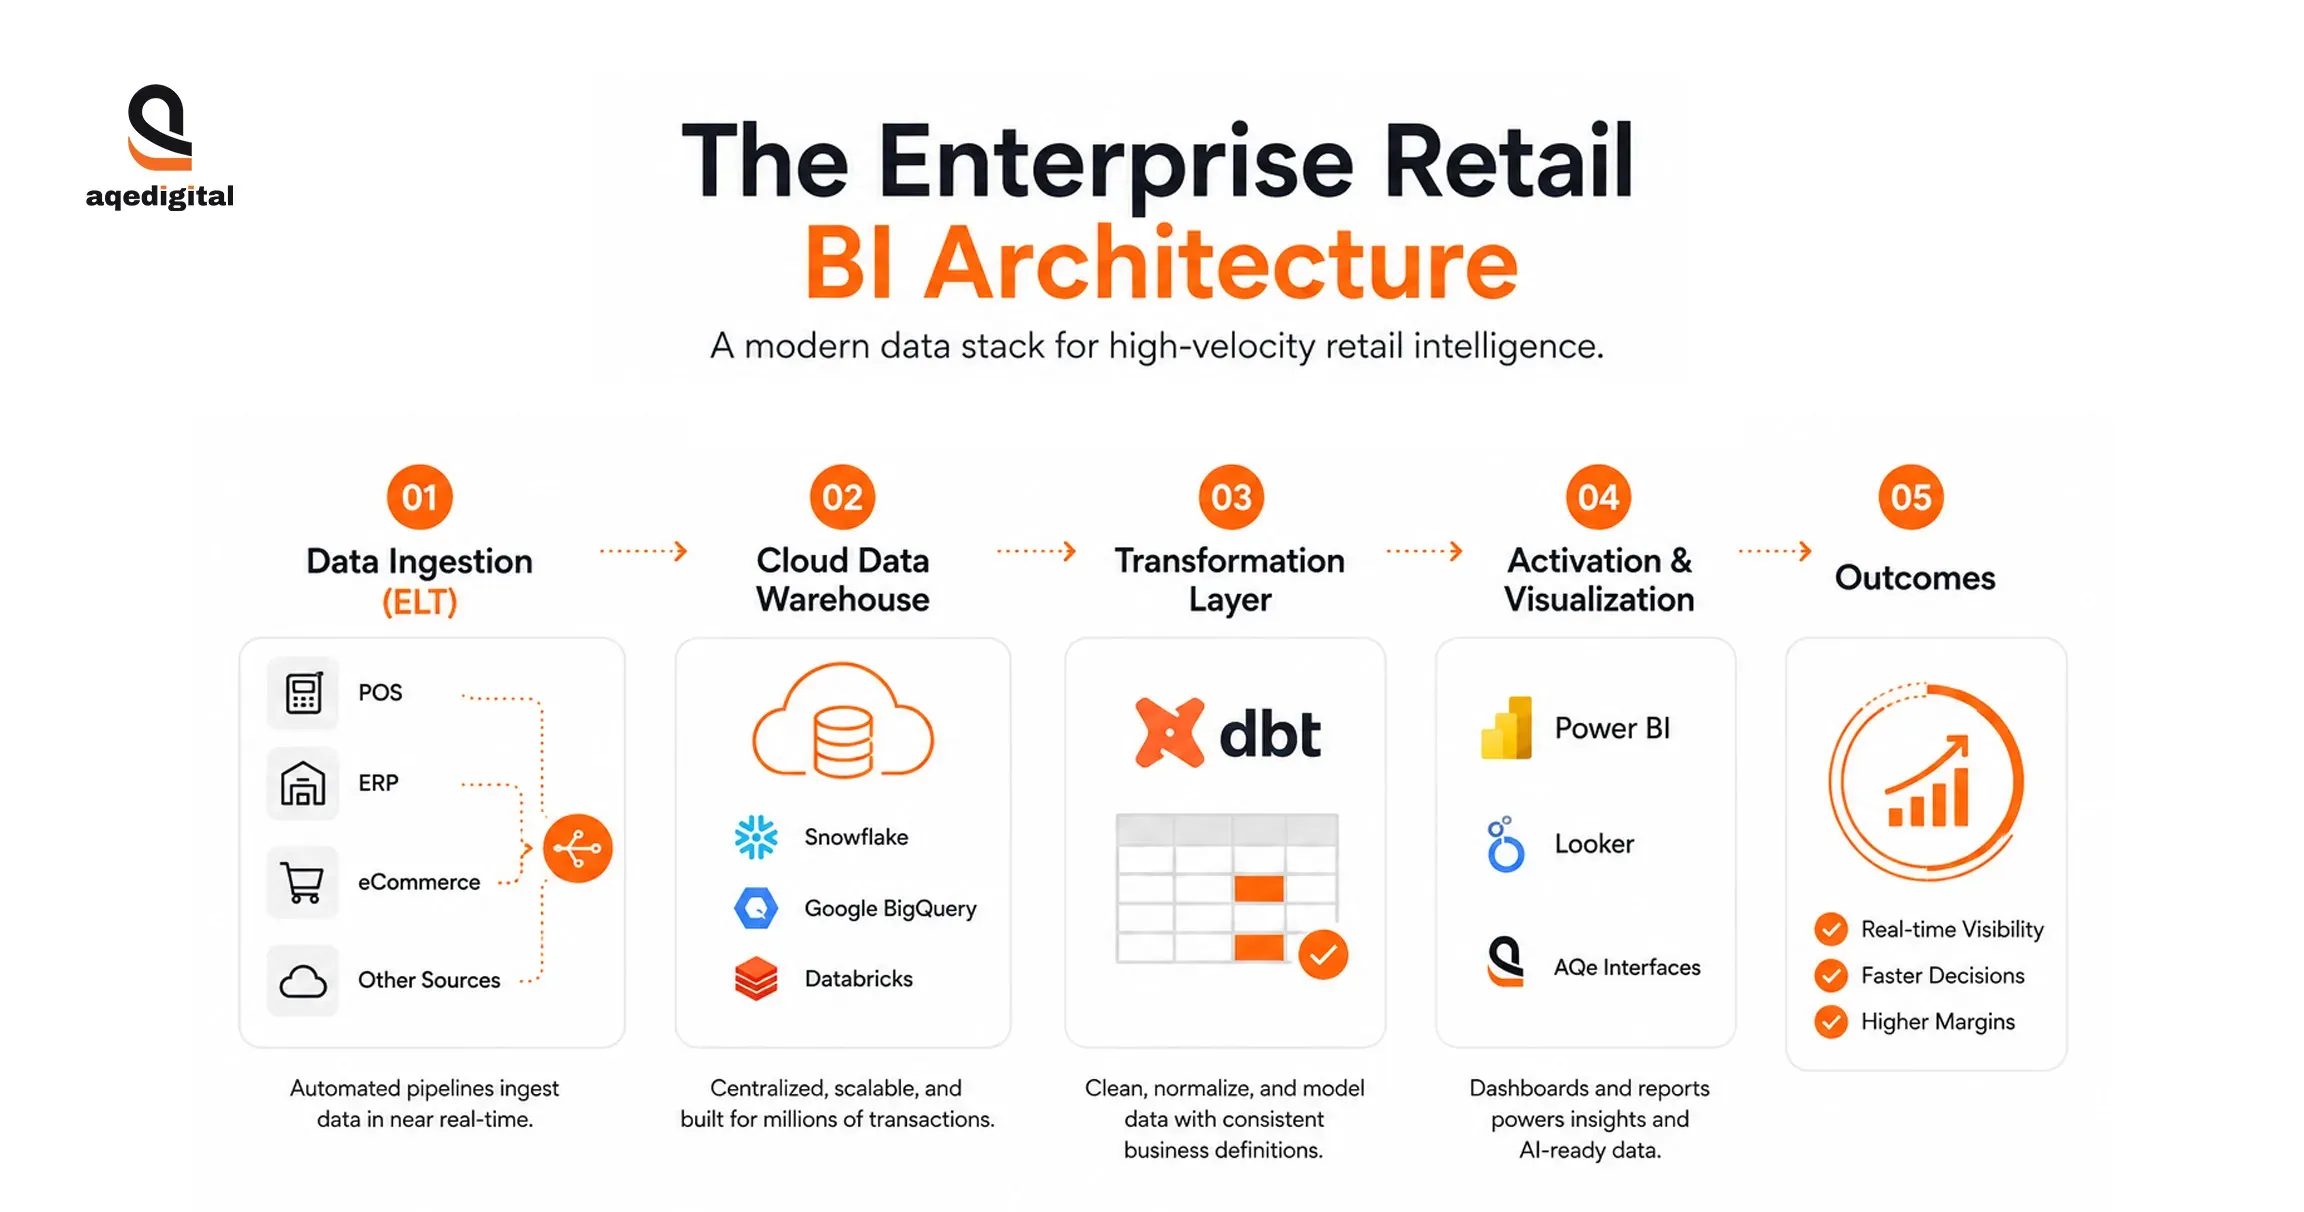
Here is the blueprint AQe Digital uses to architect resilient retail intelligence:
- Data Ingestion (ELT): We deploy automated pipelines (like Fivetran or Airbyte) to pull raw data from your POS, ERP, and e-commerce platforms in near real-time. No more manual CSV exports.
- The Cloud Data Warehouse: The raw data lands in a centralized, highly scalable repository. We typically architect this layer on Snowflake, Google BigQuery, or Databricks, ensuring it can handle millions of SKU-level transactions without latency.
- The Transformation Layer: Raw data is messy. Using tools like dbt (data build tool), we clean, normalize, and model the data. This is where we define what "net revenue" or "sell-through rate" actually means for your entiremodelling organization.
- Activation and Visualization: Finally, the clean data feeds into specialized dashboards (Power BI, Looker, or custom AQe interfaces). The data is now ready for human consumption and AI modeling.
Retail Analytics Strategies That Scale Across Stores
Scaling retail doesn't break your inventory system. It breaks your ability to trust any data coming out of it.
That's the real problem. Go from three boutiques to thirty stores, and the operational complexity doesn't multiply; it compounds. Inventory decisions that were manageable on gut feel and weekly spreadsheet reviews start producing phantom stockouts.
Customer loyalty programs that worked in one market fall flat in another. And the consultants who walk in with dashboards and slide decks rarely explain why: your data architecture was never built for this.
The retailers who scale without blowing up their margins have made one fundamental shift before everything else. They stopped managing stores and started managing information.
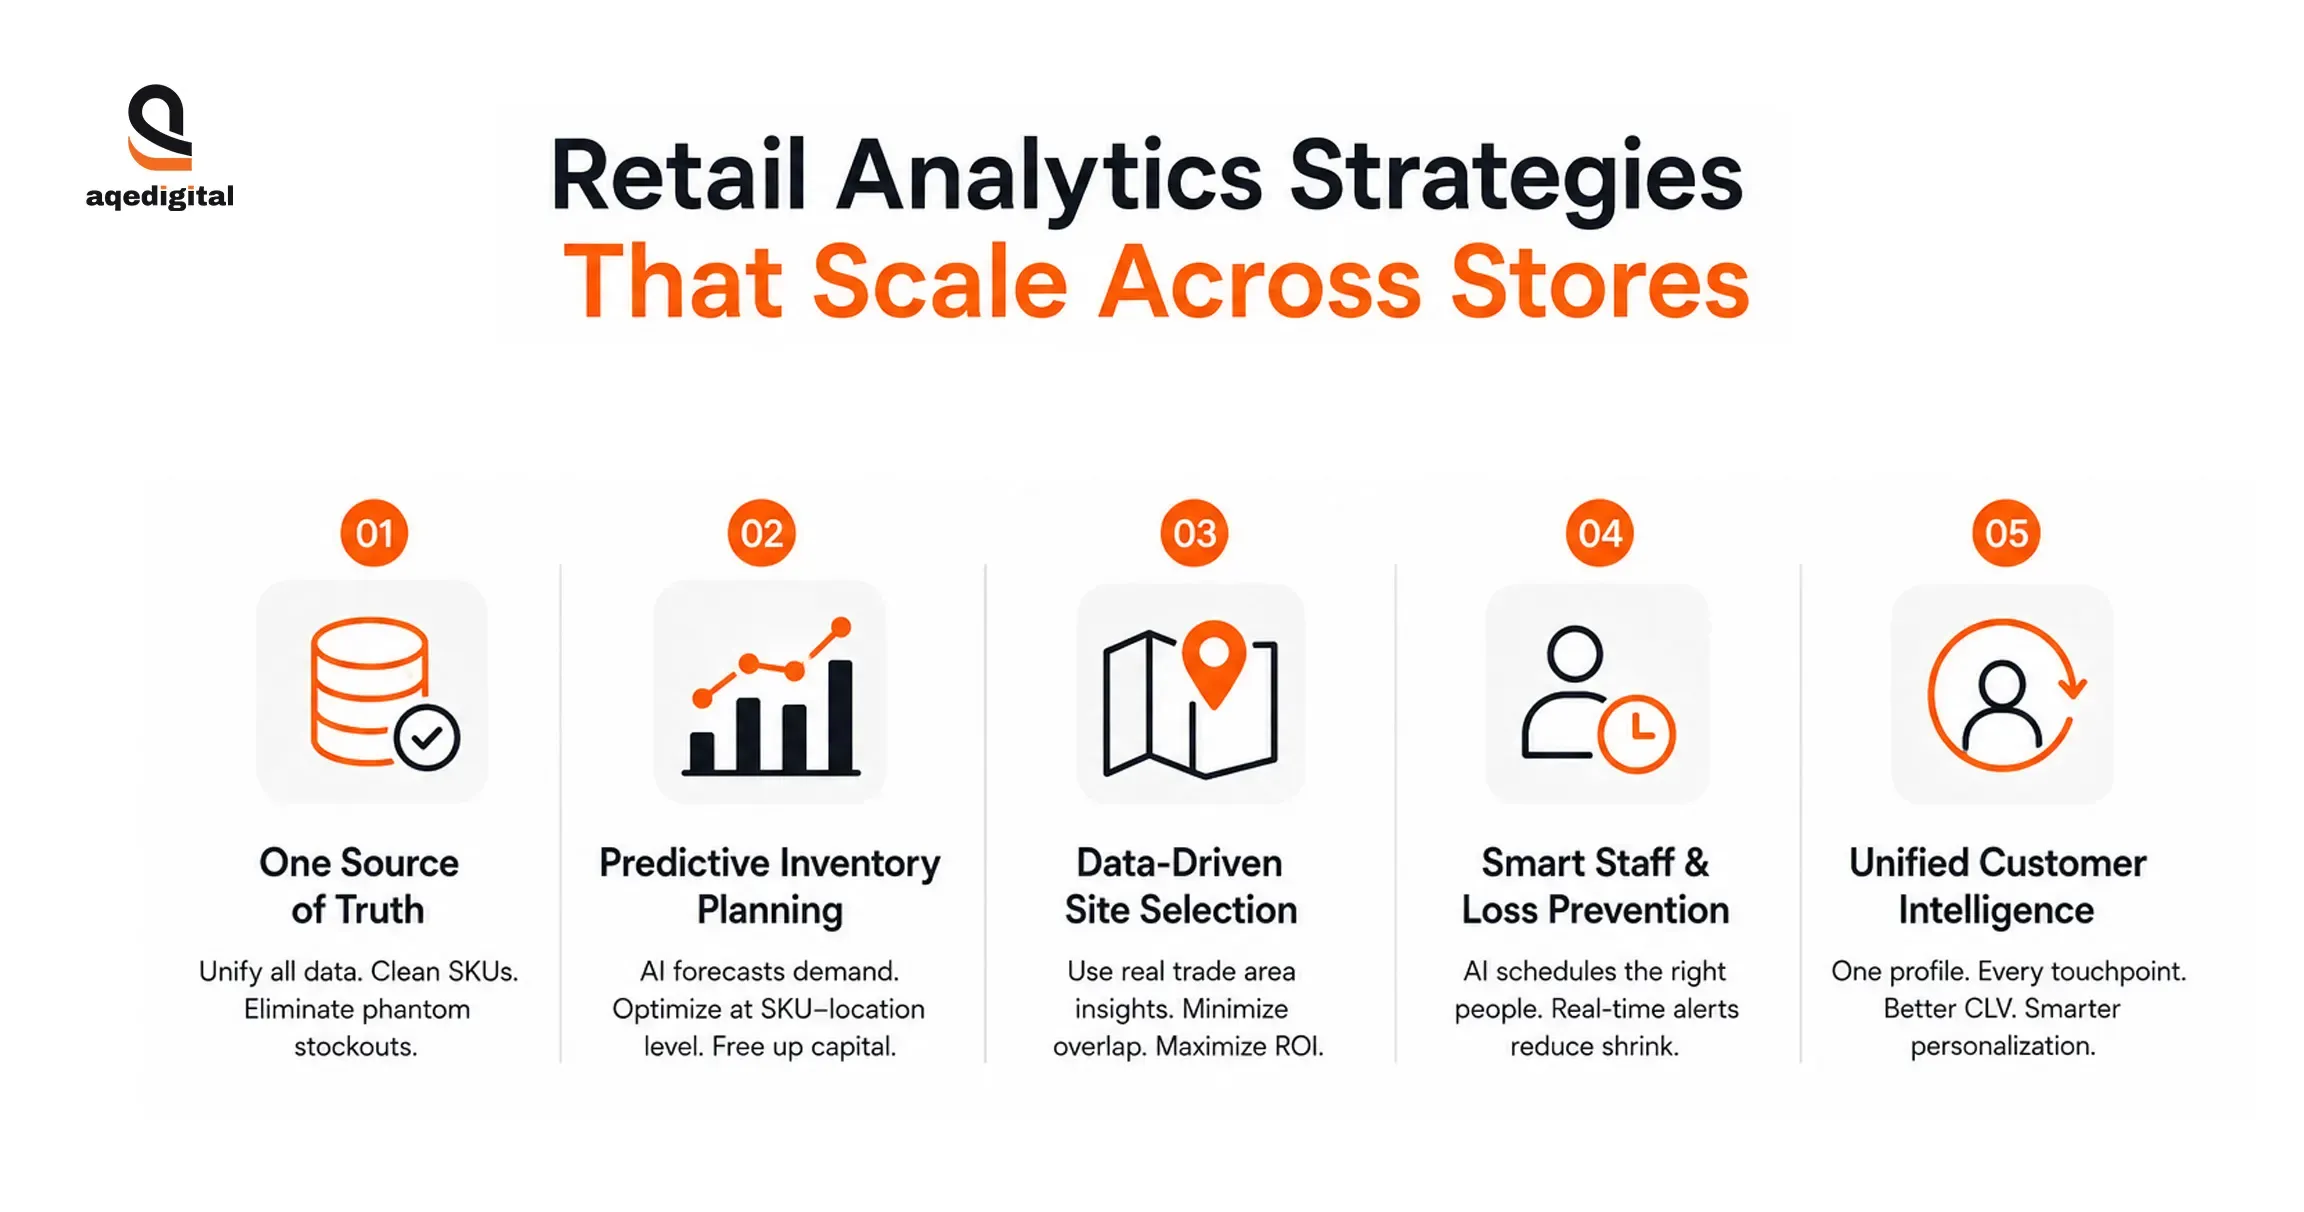
1. Build One Source of Truth Before You Open Another Door
Most multi-store intelligence failures start with fragmented data. POS system in one silo. E-commerce platform in another. Supply chain running off a spreadsheet someone built in 2019 and is terrified to touch. Every department is technically working from "the latest numbers," they're just not the same numbers.
Zara figured this out decades ago. Their centralized, cloud-based ERP doesn't just connect inventory and logistics; it collapses design-to-distribution cycles down to two weeks because every decision point feeds off the same real-time data. That's not a technology advantage. It's a data governance decision that happened to run on technology.
SKU hygiene is less glamorous but equally critical. Duplicate item codes across systems generate phantom stockouts. Your system thinks you're out of a product because two departments are calling it different things. Build standard metadata definitions across every system before you add a location, and every department operates from identical information. Without that, every analytics layer you build on top is solving for the wrong problem.
2. Predictive Inventory Beats Reactive Firefighting. Every Time.
Inventory is where capital goes to hide. Across multiple locations, the risk isn't just overstocking or understocking in isolation; it's misallocating capital at scale while thinking you're making data-driven decisions.
Advanced BI systems running machine learning against historical sales, seasonal patterns, and external signals (weather, local events, competitor promos) push short-range demand forecasting accuracy to 85-90%. That's not a marginal improvement over gut feel. It changes what you can do operationally. At the SKU-location level, GMROI, sell-through rates, and weeks-of-supply give you the actual levers, not aggregate revenue figures that smooth over the problems underneath.
Walmart doesn't hide the operational insight here: they share demand projections directly with suppliers and cross-dock products from inbound to outbound trucks without intermediate storage.
IKEA runs a cost-per-touch strategy in high-flow warehouse facilities; the more automated the handling of popular items, the lower the margin erosion per unit. Neither of these approaches requires a massive technology budget. Both require the discipline to treat inventory as a capital allocation problem, not a logistics problem.
3. Site Selection Without Geospatial Data Is Just Expensive Guessing
Opening a new store is a permanent capital decision with a 3-to-5-year consequence window at minimum. The radius-ring analysis most retailers still use to evaluate locations, a circle on a map with projected population counts, tells you who lives nearby. It doesn't tell you how people actually move.
True Trade Area analysis uses mobile device-origin data to map real customer routes. That's a different picture entirely. It shows which neighborhoods actually feed your existing stores, whether a proposed anchor tenant drives complementary foot traffic or competes for the same customer, and where your new location's trade area overlaps with a store you already operate.
That last point is underpriced in most expansion planning. Cannibalization doesn't show up in the site selection model; it shows up 18 months after opening when two stores in the same real trade area split a market that wasn't big enough for both of them. Map the actual overlap before you sign the lease.
4. Static Staffing Models Are a Margin Problem, Not an HR Problem
Overstaffing during slow periods and understaffing during peak traffic aren't scheduling failures. They're forecasting failures, and they cost money in two directions simultaneously.
AI-powered scheduling tools predict hourly foot traffic against local events, weather patterns, and historical store data. The retailers using them report labor cost reductions up to 15% without degrading customer experience. Some report improving it, because the right number of people are actually on the floor when the store is busy.
Loss prevention follows the same logic shift. Manual auditing catches shrinkage after it happens. Exception-based reporting (EBR) flags anomalies in real time: unusual refund rates at specific
POS terminals, checkout patterns that don't match product scan sequences. Visual AI reads surveillance feeds and catches self-checkout scan avoidance as it happens. The move from reactive to proactive isn't a philosophical preference.
5. Fragmented Customer Profiles Distort Every Metric You're Tracking
One customer browses on mobile, checks stock online, walks into a store, and buys. Without identity resolution linking those touchpoints through a loyalty ID or hashed email, your system treats this as three separate people. Your CLV calculations are wrong. Your retention rates are wrong. Your churn predictions are wrong.
Once those identities are unified, segmentation stops being demographic and starts being behavioral. You can identify your highest-value spenders, flag at-risk customers before they churn, and personalize promotions against actual purchase patterns across the network. The brands doing this well don't send the same email to everyone. They send 40 different versions because they know exactly who's getting each one.
Data governance and role-specific dashboards determine whether any of this actually gets used. Executives need portfolio-level views. Store managers need hyper-local operational alerts.
Pack the same dashboard with both, and neither person will use it. The analytics are only as good as the decisions they inform.

Dynamic Pricing and Pricing Intelligence for Retailers
Pricing is the fastest margin lever in multi-store retail. Most chains treat it like an accounting function.
That's the gap. AI retail business intelligence has moved pricing from a static, quarterly exercise into a real-time competitive instrument. The retailers pulling 5-10% margin expansion without touching customer satisfaction aren't doing anything exotic. They've replaced rigid cost-plus rules with algorithms that actually read the market.
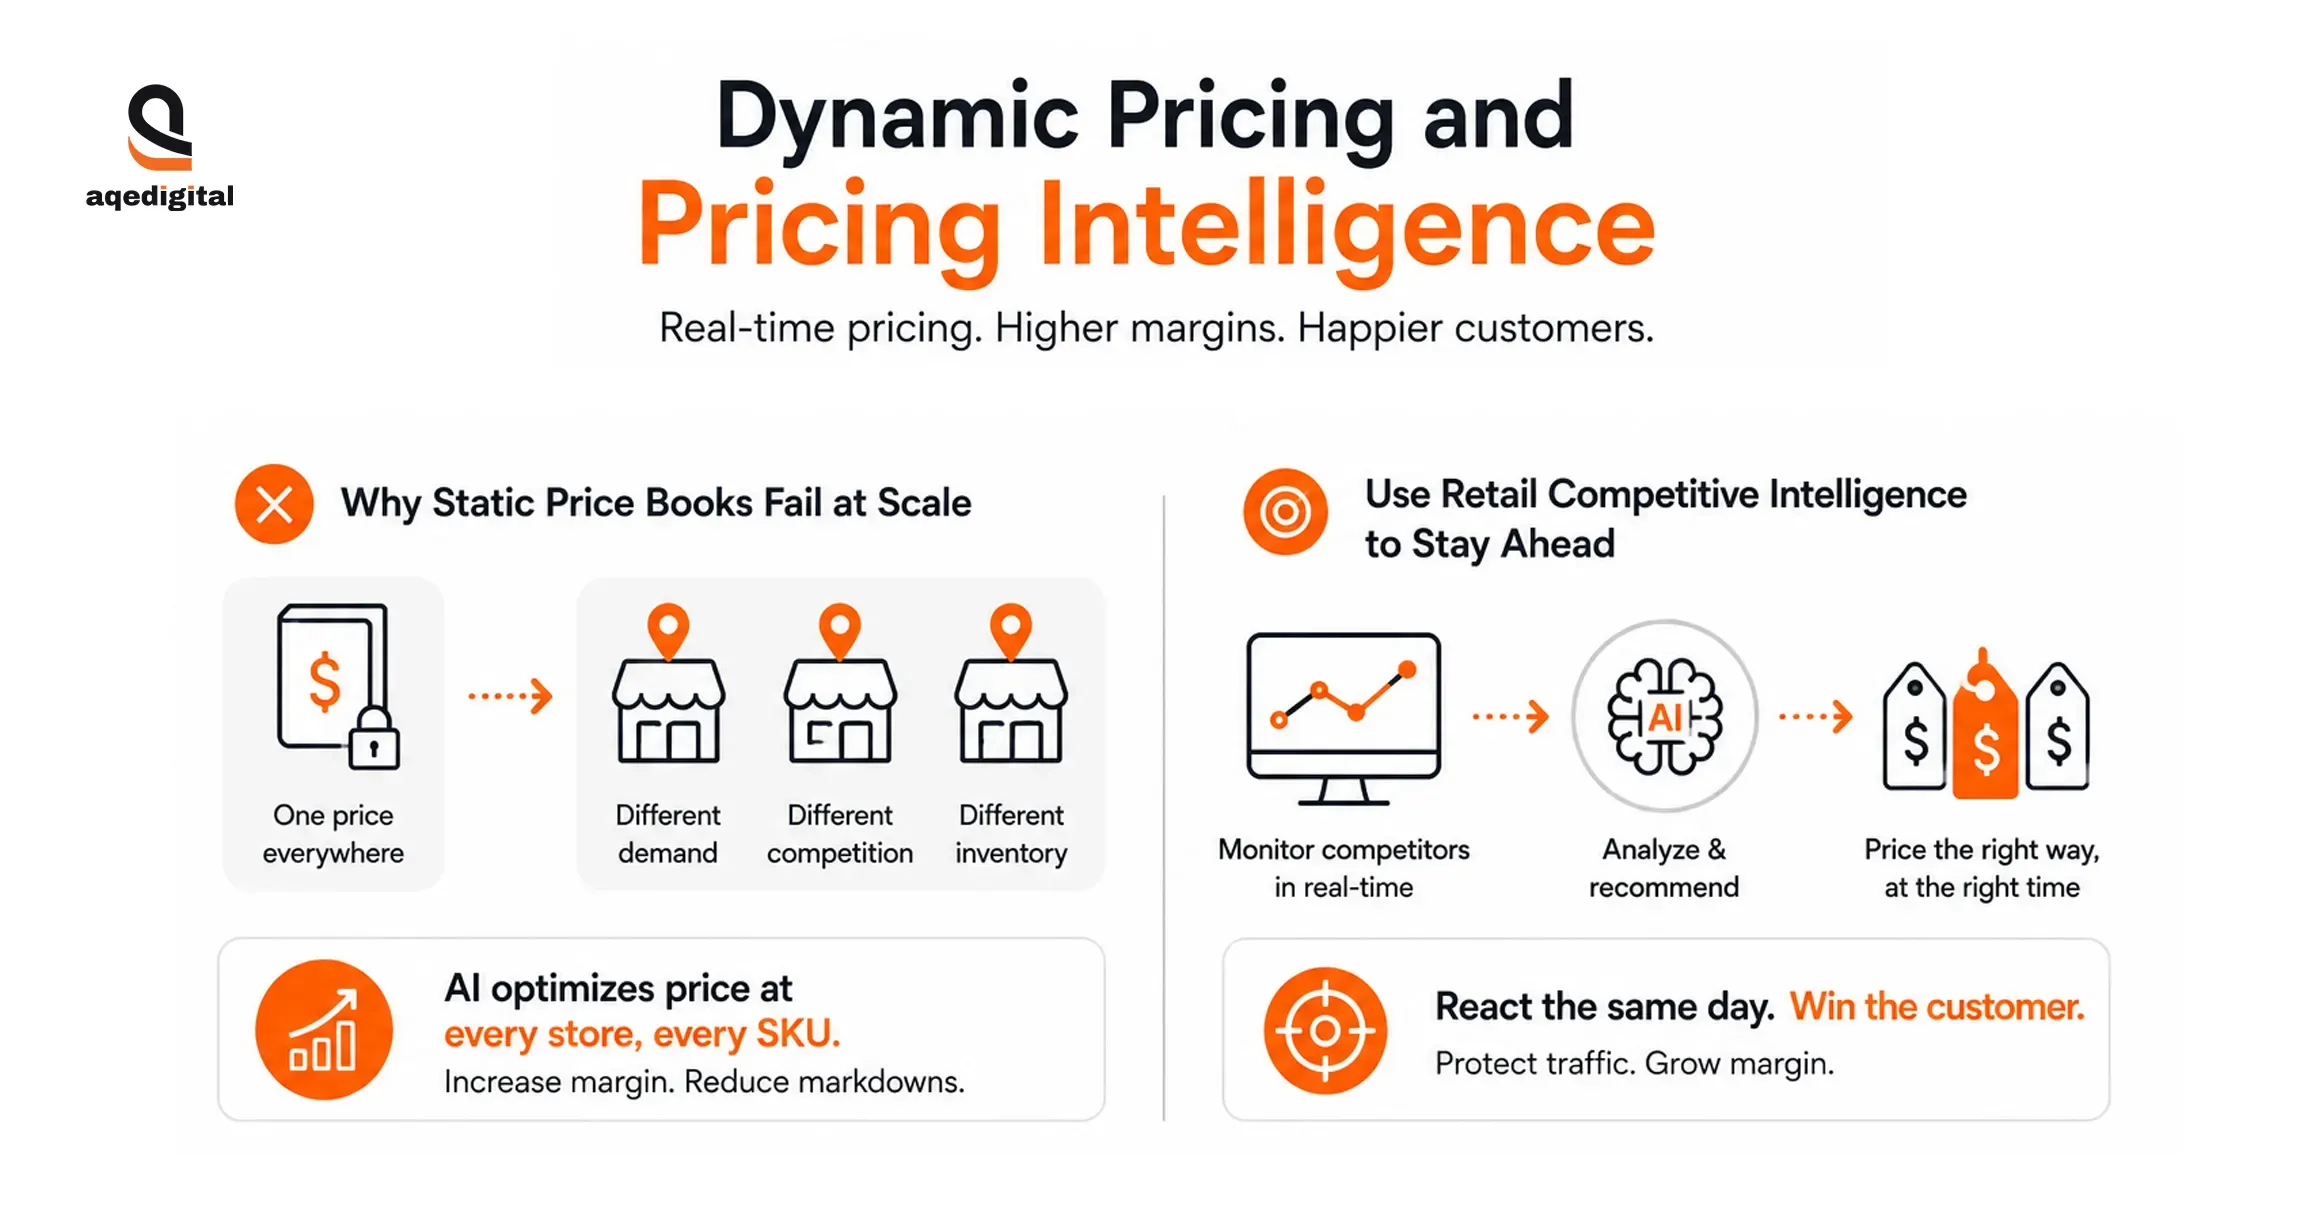
Why Static Price Books Fail at Scale?
Static price books make one assumption that kills margins at scale: that every location faces the same demand, the same competitive pressure, and the same inventory age. None of that is true.
Advanced retail pricing intelligence evaluates competitor pricing, local demand signals, and per-location inventory levels continuously, then recommends the most precise price point for every SKU at every store. A product moving slowly in one region gets a targeted markdown before it becomes dead stock. The same product, still selling at full price two markets over, holds its margin. One rule applied everywhere gets neither outcome right.
Using Retail Competitive Intelligence to Stay Ahead
Retail competitive intelligence makes this operational rather than theoretical. Real-time monitoring of competitor pricing, promotions, and assortment changes feeds directly into your decision loop. When a rival drops the price on a key value item, you see it the same day.
You choose whether to match, hold, or counter with a bundle while the customer is still deciding. Waiting a week to react is a week of traffic you don't recover.
Computer Vision Retail Intelligence Platform: Reading the Store Floor
Transactional data captures the end of the customer journey. It tells you what sold. It tells you nothing about what a shopper picked up and put back, where they stopped and walked away, or which queue length made them abandon the basket entirely.
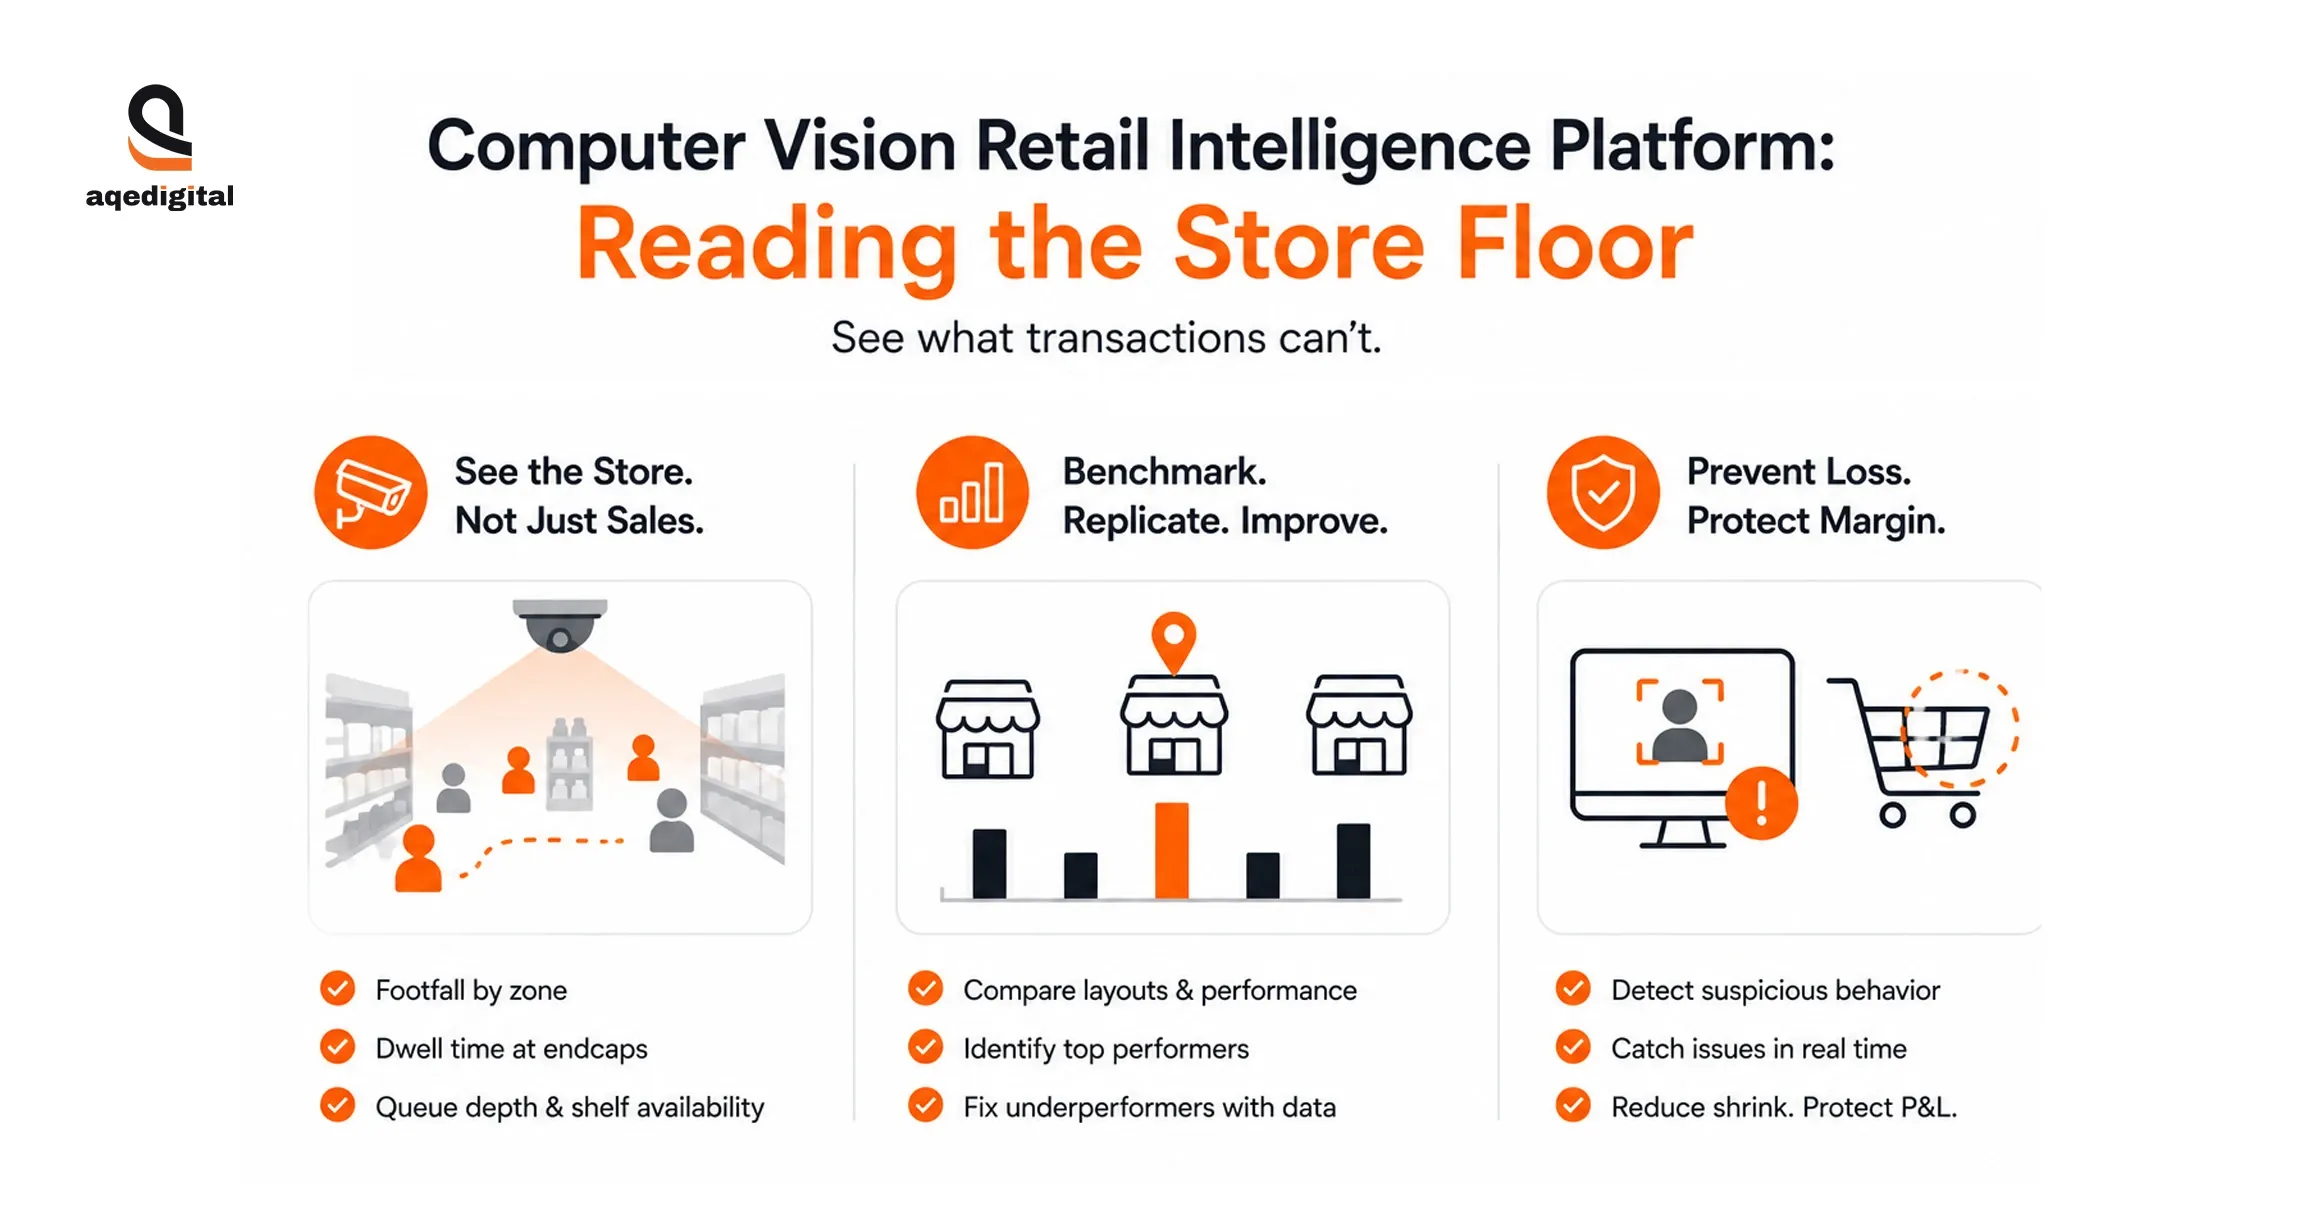
How a Computer Vision Retail Intelligence Platform Works
A computer vision retail intelligence platform closes that blind spot. Using in-store cameras and edge AI models, the platform converts the physical floor into structured operational data: footfall by zone, dwell time at endcaps, queue depth at checkout, shelf availability in real time, and planogram compliance across locations.
When a shelf empties mid-shift, the system flags it before the next customer finds the gap. When a queue builds past a threshold, staff get the alert before the experience degrades.
Benchmarking Store Performance Across Locations
Across a multi-store network, this layer becomes a consistent performance benchmark. You see exactly which layouts drive dwell, which endcap positions convert, and which locations systematically lose shoppers at checkout. Then you replicate the winners and fix the underperformers with data behind every decision.
Loss Prevention Through Visual AI
The same computer vision layer doubles as a loss prevention tool. Edge AI detects self-checkout scan avoidance, sweethearting, and unusual void patterns in real time, before shrinkage hits the P&L rather than after.
Data Governance: Compliance Isn't Optional
Deploying cameras at scale raises a legitimate question immediately: what happens to the footage?
How Retail Business Intelligence Solutions Handle Privacy
Modern retail business intelligence solutions address this through edge computing. Video feeds are processed locally on the camera hardware. The system extracts the operational metadata it needs, footfall counts, dwell intervals, and queue depth and discards the video immediately.
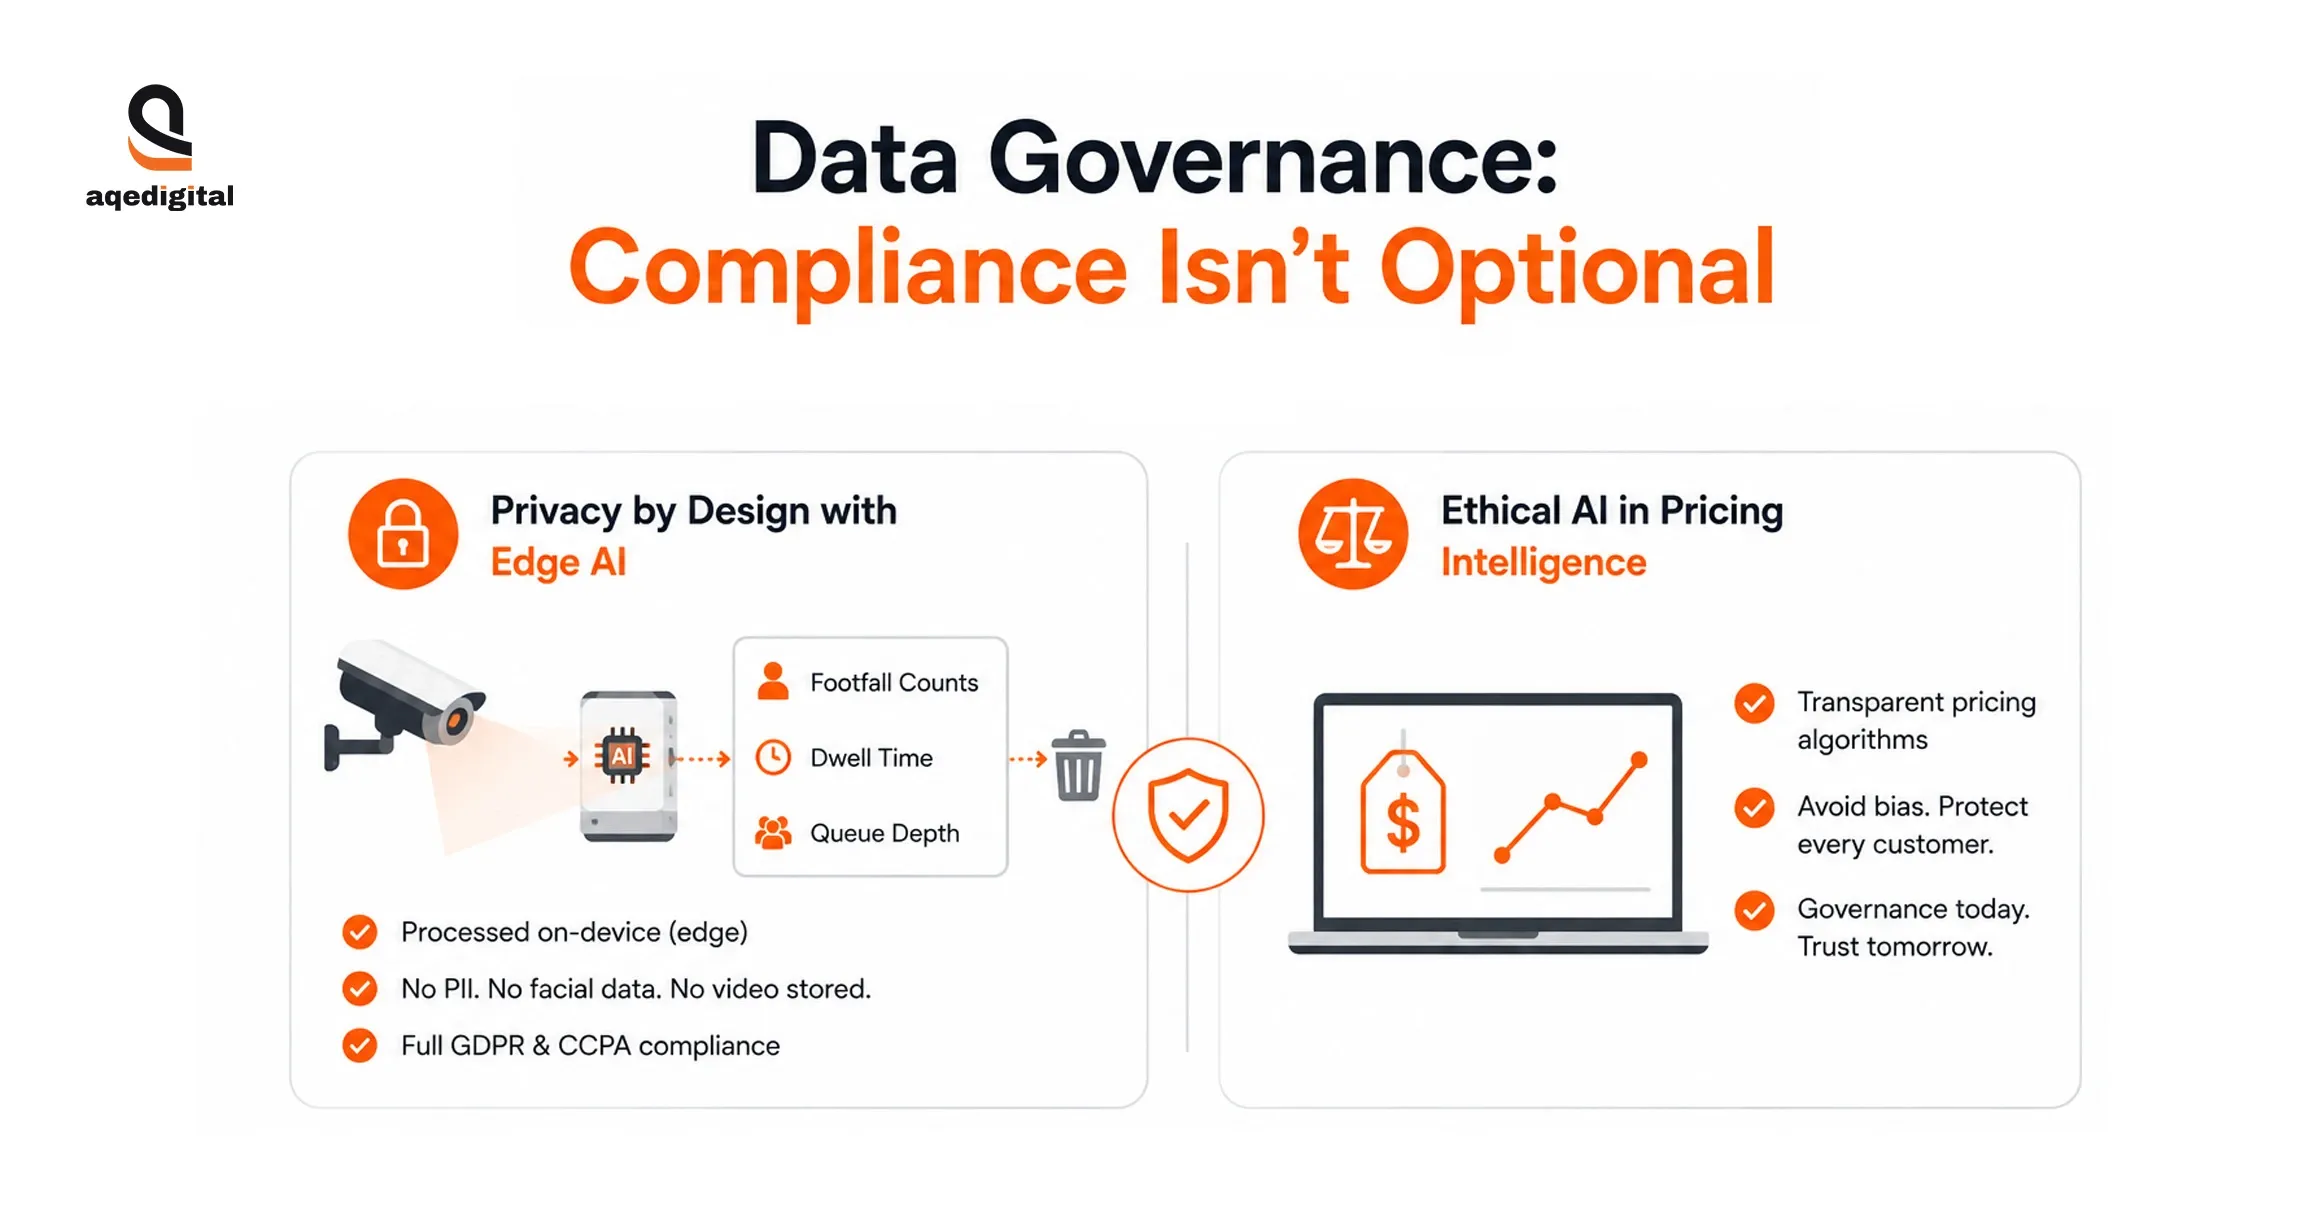 No personally identifiable information leaves the device. No facial recognition data reaches the cloud. The result is full compliance with GDPR and CCPA without sacrificing the signal the business needs.
Ethical AI Frameworks in Retail Pricing Intelligence
Ethical AI pricing frameworks follow the same logic. As retail pricing intelligence grows more sophisticated, regulators and retailers alike are building transparency requirements into dynamic pricing algorithms. The goal is to ensure that price optimization doesn't inadvertently discriminate against vulnerable customer segments. Getting ahead of that is a governance decision, not a compliance scramble.
Change Management: The Adoption Problem Nobody Budgets For
Dashboards don't generate ROI. People do.
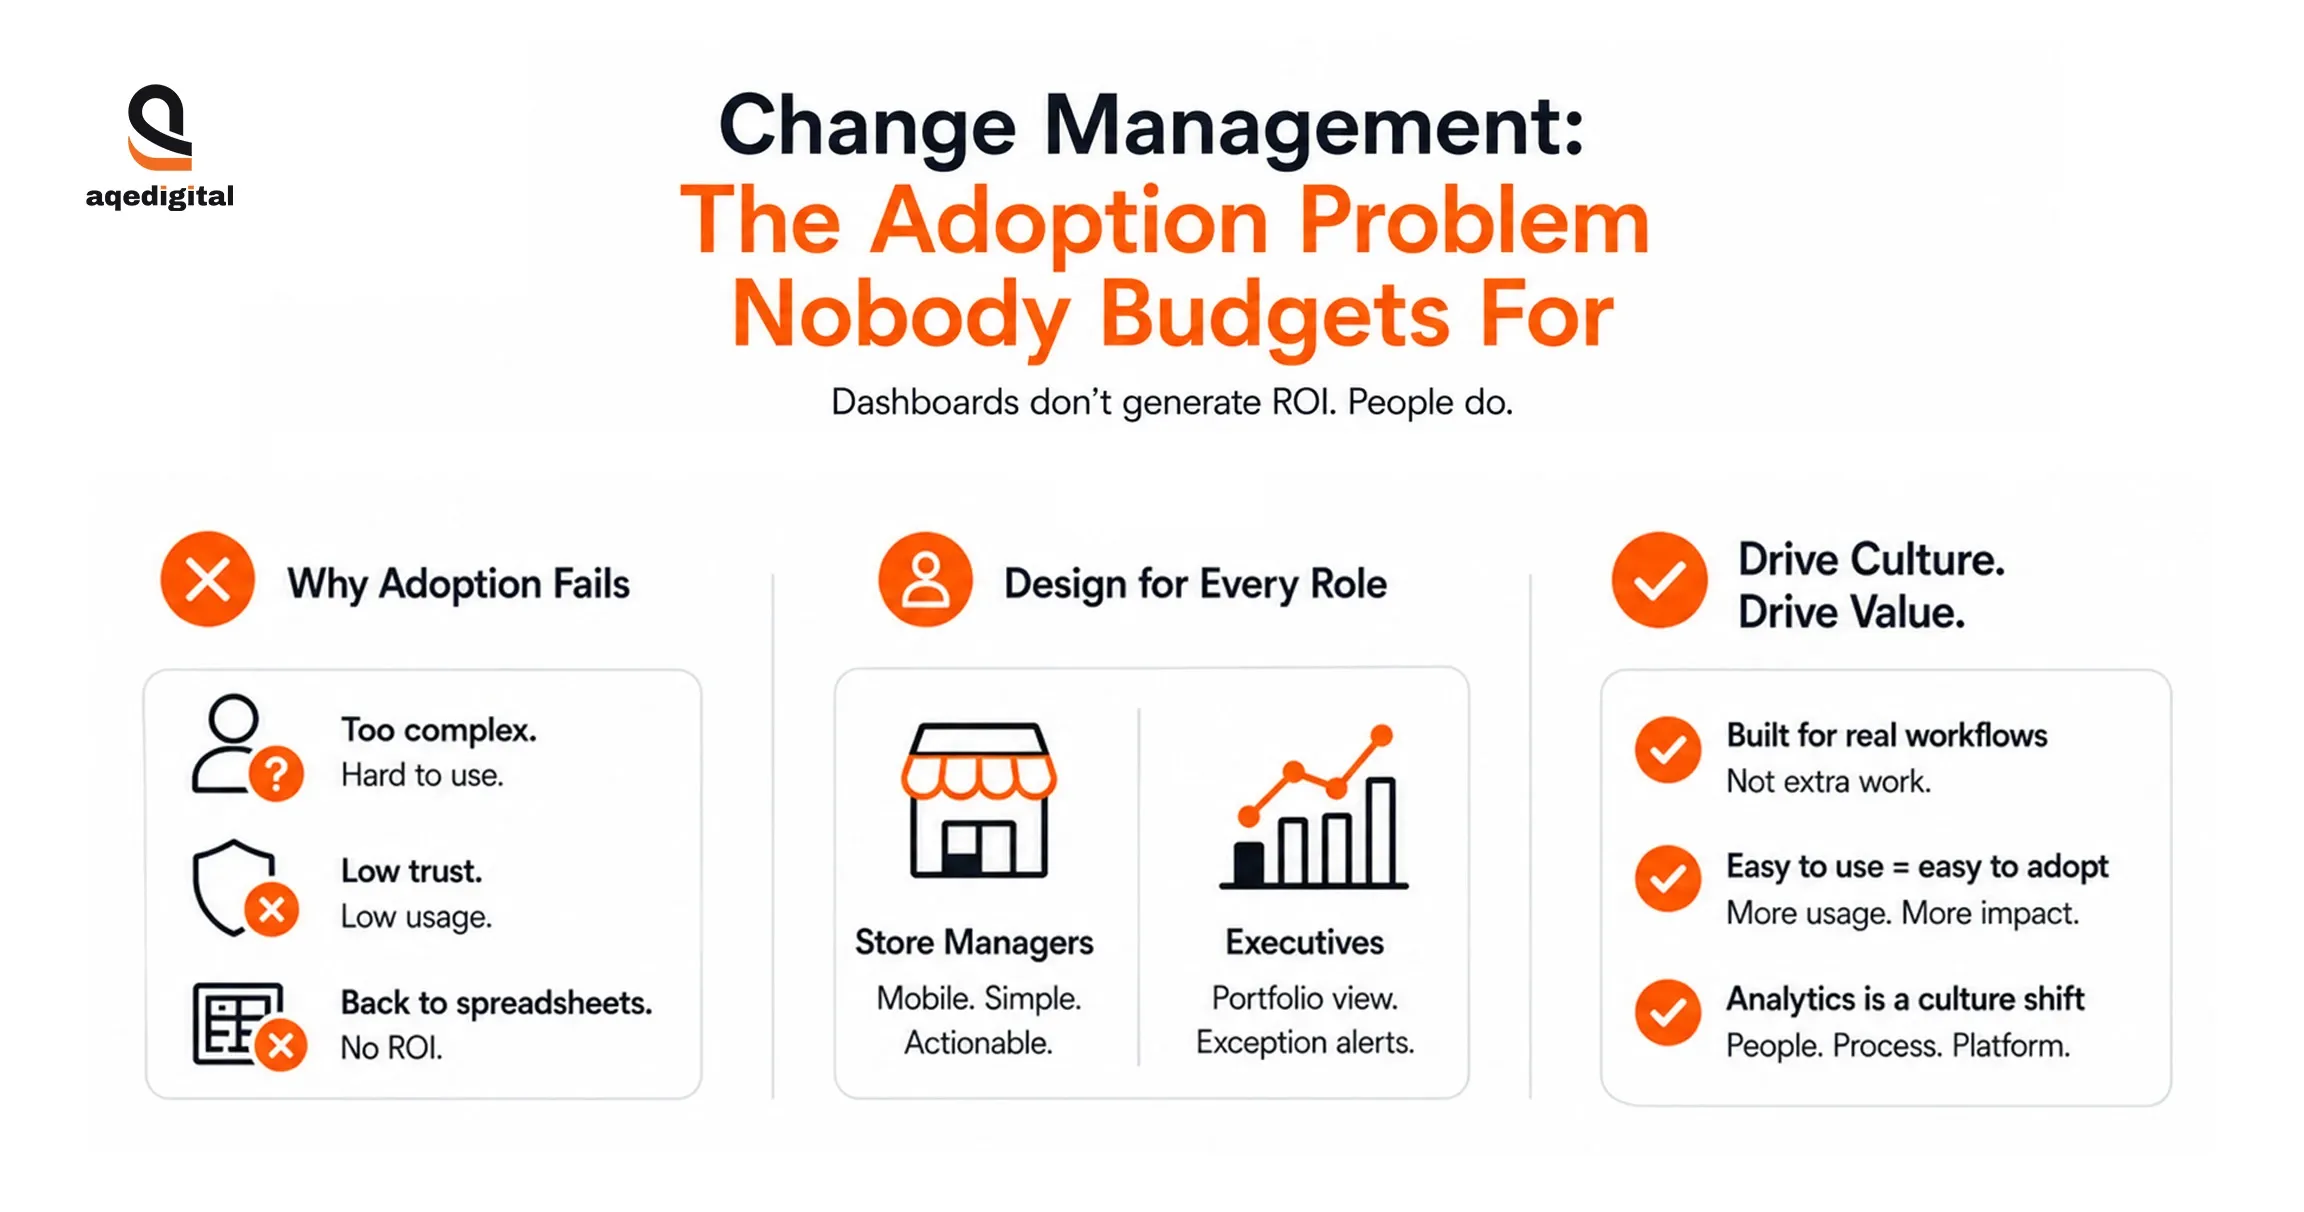
That distinction sounds obvious until you see a six-figure retail intelligence software deployment sitting at 12% active user rate six months after go-live. The model is sophisticated. The interface confused people. The regional managers kept using the spreadsheet they built three years ago because at least they understood it.
Multi-store BI rollout failures are almost never technical. They're cultural, and they're predictable. When employees don't trust a platform or can't navigate it within 30 seconds, they revert. Every manual decision made outside the system is a return on investment that the business paid for and didn't collect.
Role-Based Retail Business Intelligence Solutions That Drive Adoption
Preventing this starts at the design stage. A store manager doesn't need a 40-tab BI tool. They need a mobile-optimized, single-screen view telling them exactly what requires attention before the shift starts.
An executive needs portfolio-level signals and exception flags, not granular SKU data that belongs in a different role's workflow. Role-based retail business intelligence solutions built around existing daily routines don't require adoption campaigns. They get used because they reduce friction rather than add it.
Scaling retail analytics is not an IT upgrade. It's a cultural transformation that requires precise, low-friction, and tightly governed retail intelligence software at every layer. The technology is rarely the constraint. The question is whether the organization is built to use it.
How AQe Digital Builds Retail Data Engines That Last?
Off-the-shelf software stalls because it ignores how your specific stores actually run. AQe Digital builds online retail solutions the other way around.
We map your POS, inventory, loyalty, and eCommerce sources, then build a unified data layer so every location reports on one truth. On top of that foundation, we layer SKU-level forecasting, dynamic pricing engines, and computer vision models tuned precisely to your store formats.
With 27+ years of engineering experience and over 650 professionals, we deliver in phased sprints. You see value in weeks, not after a year-long rollout.
The Next Step in Multi-Store Analytics
Multi-store growth is won by speed of decision, not volume of data. The retailers pulling ahead are not the ones with the most reports. They are the ones whose pricing, inventory, and floor decisions happen in hours, guided by a single source of truth that every store shares. Unify the data. Forecast at the SKU. Price with intelligence. Watch the floor. That is the playbook.